
SPX Perfect Buying Opportunity At The Blue Box Area
In this technical blog, we will look at the past performance of the 1-hour Elliott Wave Charts of SPX. We presented to members at the elliottwave-forecast. In which, the rally from the 05 January 2024 low unfolded as an impulse structure and showed a bullish sequence. Suggested that the index should see more upside extension to complete the impulse sequence. Therefore, we advised members not to sell the index & buy the dips in 3, 7, or 11 swings at the blue box areas. We will explain the structure & forecast below:
SPX 1-Hour Elliott Wave Chart From 4.05.2024
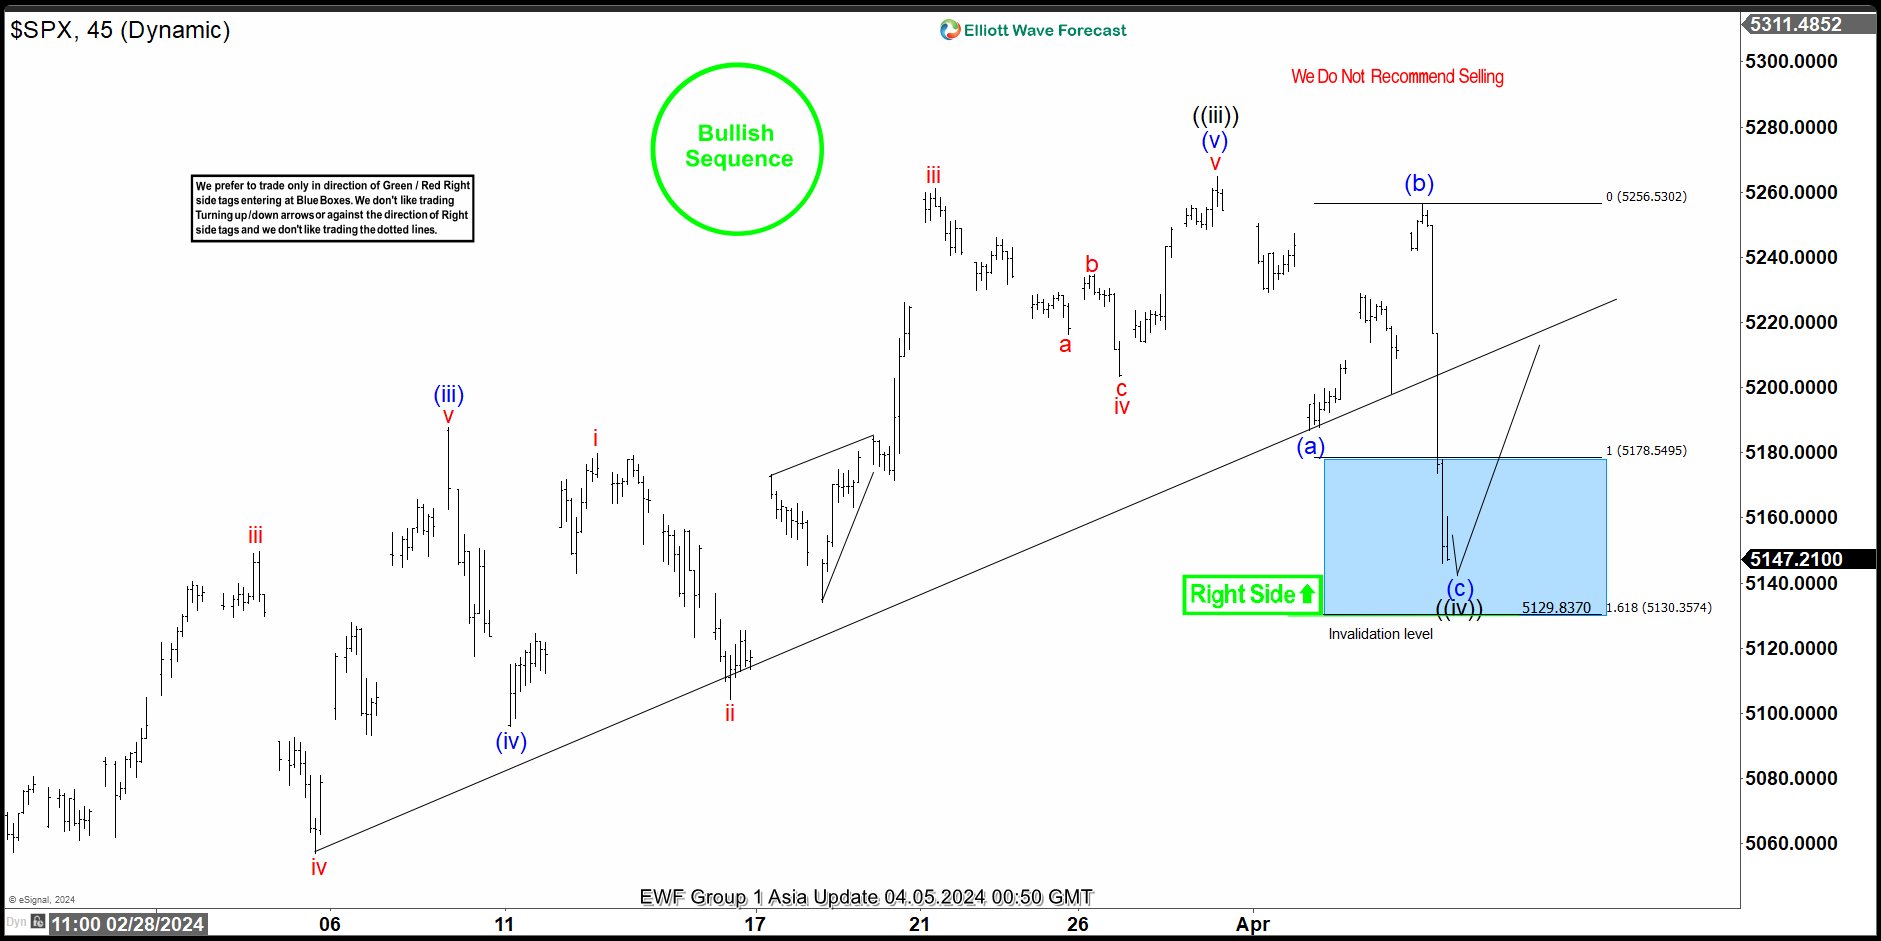
Here’s the 1-hour Elliott wave chart from the 4/05/2024 Asia update. In which, the short-term cycle from the 1/17/2024 low ended in wave ((iii)) as impulse at $5264.85 high. Down from there, the index made a pullback in wave ((iv)) to correct that cycle. The internals of that pullback unfolded as Elliott wave zigzag structure where wave (a) ended at $5186.71 low. Wave (b) bounce ended at $5256.59 high and wave (c) managed to reach the blue box area at $5178.54- $5130.35. From there, buyers were expected to appear looking for the next leg higher or for a 3 wave bounce minimum.
SPX Latest 1-Hour Elliott Wave Chart 4.09.2024
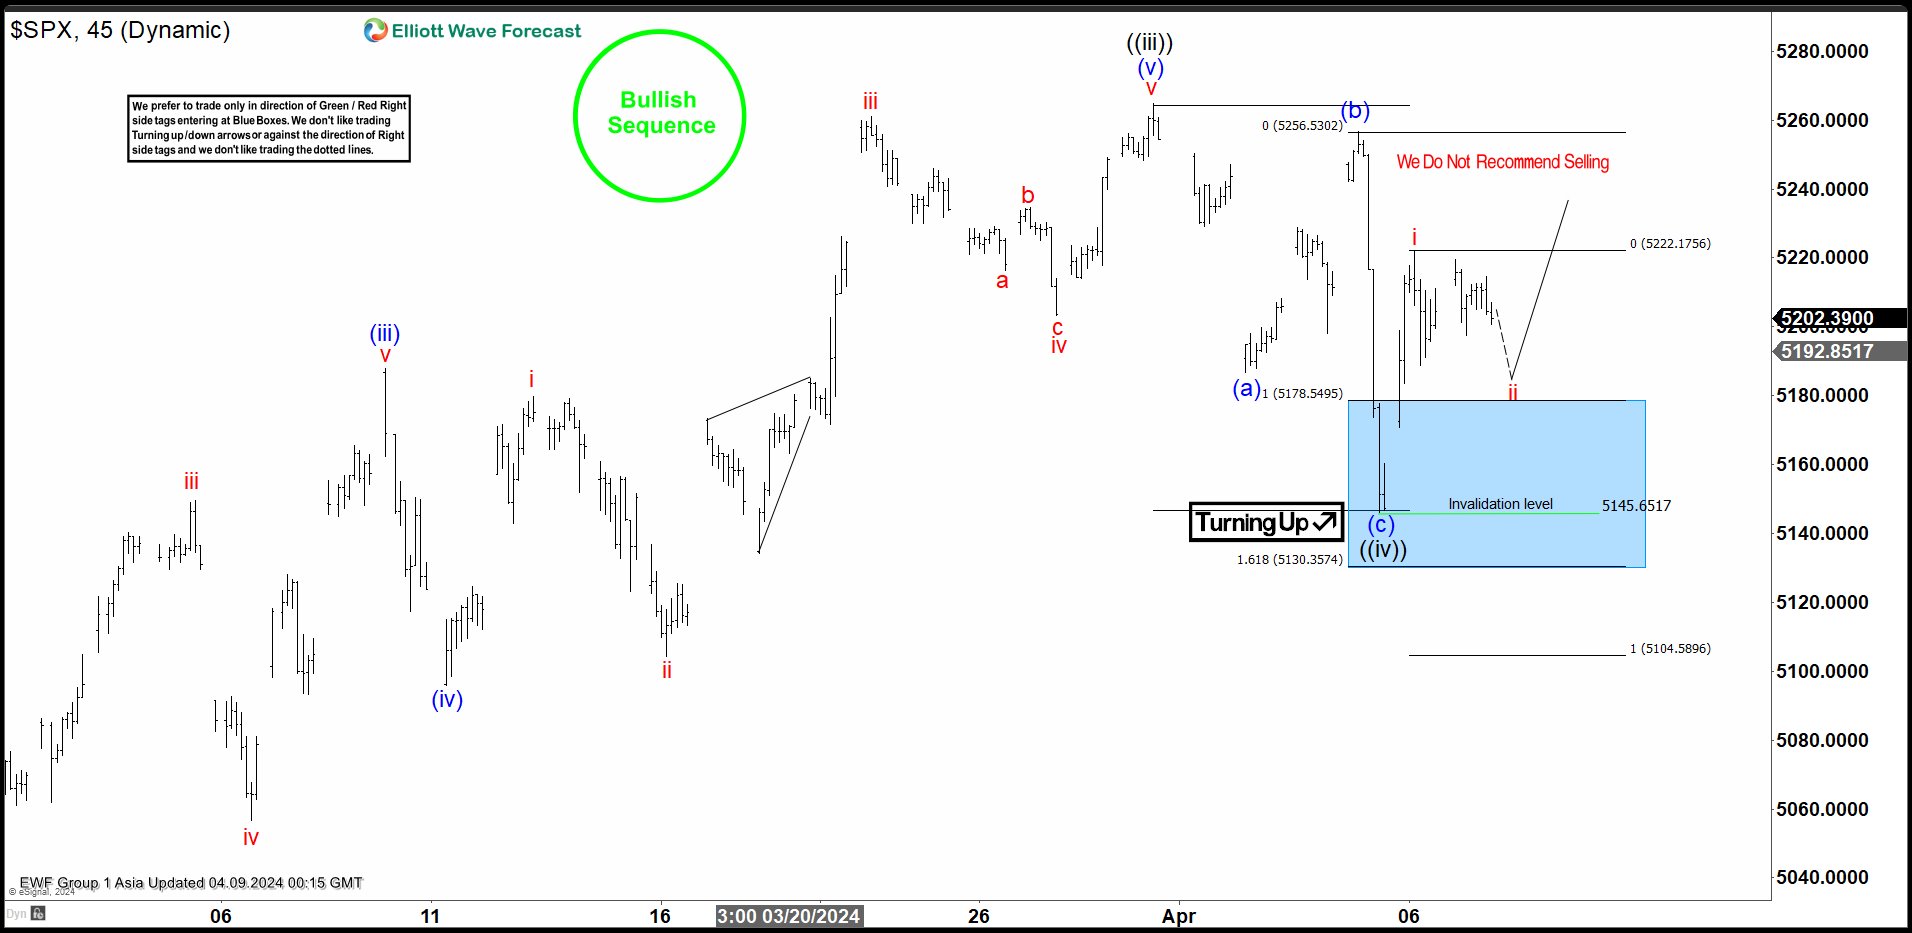
This is the latest 1-hour Elliott wave Chart from the 4/09/2024 Asia update. In which the index is showing a reaction higher taking place, right after ending the zigzag correction within the blue box area. Allowed members to create a risk-free position shortly after taking the long position at the blue box area. However, a break above $5264.85 high is still needed to confirm the next extension higher towards $5292- $5338 area higher and avoid double correction lower.
Source: https://elliottwave-forecast.com/stock-market/spx-perfect-buying-opportunity-blue-box/
On the date of publication, Elliott Wave Forecast did not have (either directly or indirectly) positions in any of the securities mentioned in this article. All information and data in this article is solely for informational purposes. For more information please view the Barchart Disclosure Policy here.
